
Services Cloud infogéré / Démarche DevOps / MLOps
Service Cloud infogéré et sur mesure
Afin de vous accompagner sur votre infrastructure d'hébergement, Emencia vous propose des services haut de gamme d’hébergement pour votre site Internet.
Le choix du service d’hébergement dépend entre autre de la criticité de votre application :

Cloud on-Premises
Vous êtes propriétaire et restez votre propre prestataire : nous vous aidons à moderniser votre plateforme et apportons un support niveau 2 et 3.

Cloud et virtualisation
Cloud et virtualisation : une infrastructure moderne, personnalisée et basée en France. Nous maîtrisons des solutions Open Source peu coûteuses comme Proxmox

Cloud privés
Nous hébergeons et infogérons votre infrastructure dédiée et conçue totalement sur mesure.
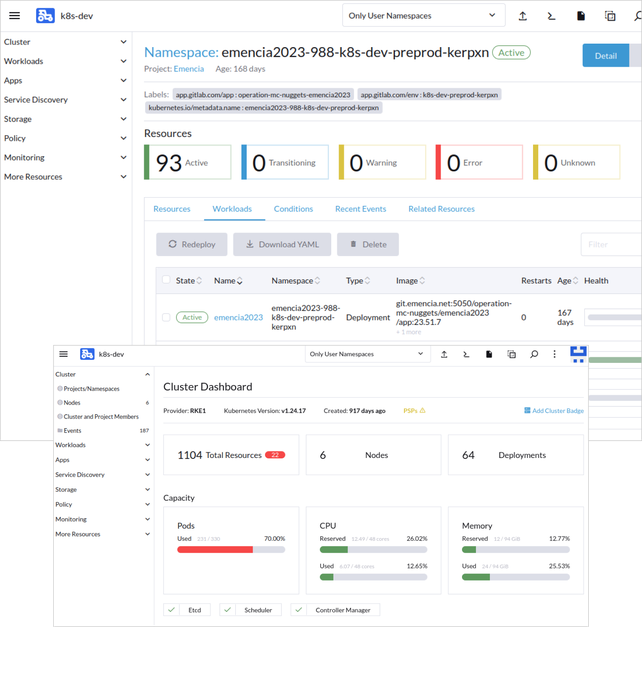
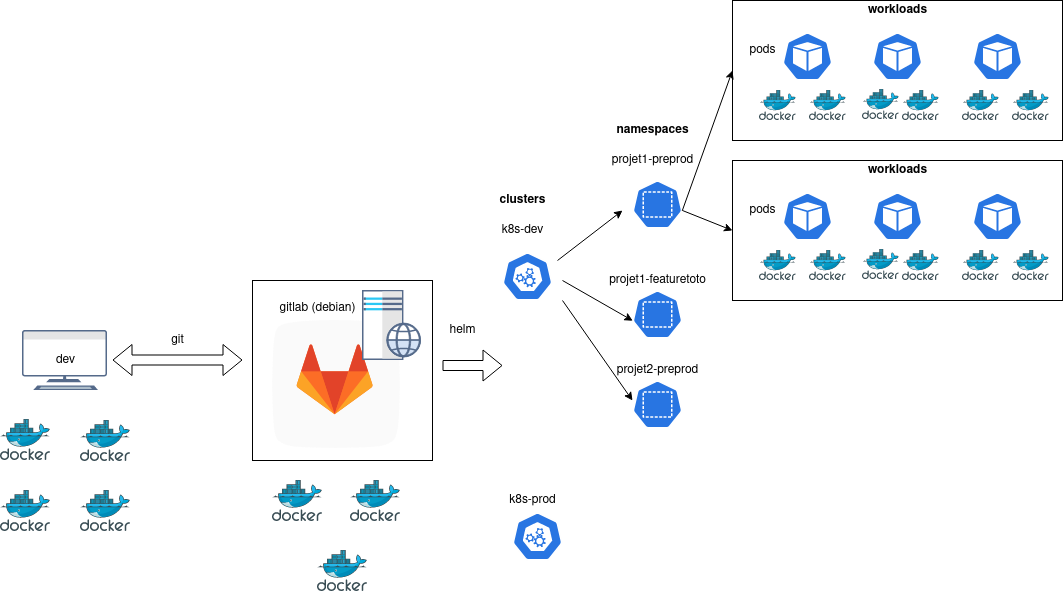
Exemple d'architecture Cloud infogéré pour nos clients Python / Django
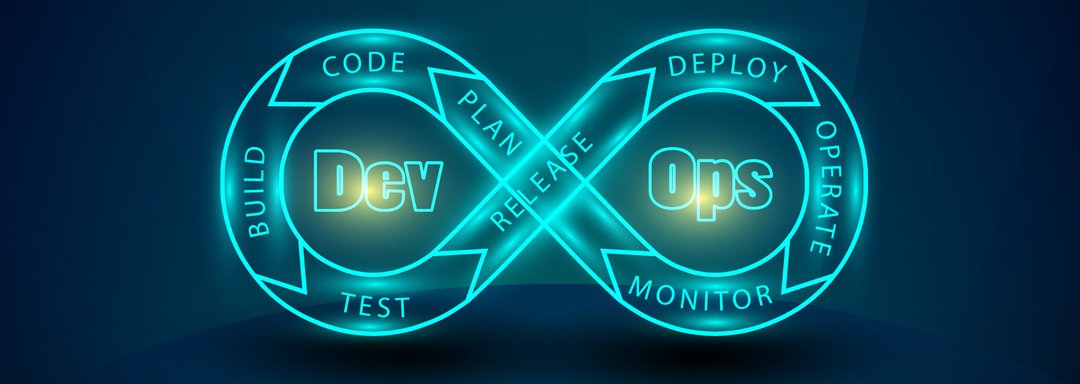
Notre démarche DevOps
Nous sommes en mesure de mettre en œuvre des solutions DevOps qui améliorent la collaboration, automatisent les processus, garantissent la qualité et la sécurité de vos applications web.
Qualité du code, déploiement rapide et augmentation de la satisfaction des utilisateurs finaux
Nous offrons une gamme de services adaptés aux besoins de nos clients : analyse et planification DevOps, configuration des outils DevOps, automatisation de l'intégration et du déploiement continu, surveillance et la gestion de la performance, ainsi que la formation et l'assistance pour l'utilisation de ces outils.
Notre objectif est de vous aider à améliorer la qualité de votre code, à réduire les temps de déploiement et à augmenter la satisfaction de vos utilisateurs finaux.

Automatiser
Automatiser votre DEV et vos infrastructures de bout en bout : conteneurs, pipeline CI/CD, GitOps, infra as code.

Accélérer
Accélérer le cycle de développement, le time-to-market produit, tout en dépensant moins d’énergie.

Optimiser / FinOps
Optimiser : Intégrer les problématiques de production dès l'environnement de développement, réduire la charge opérationnelle, diminuer les coûts (approche FinOps).

Industrialiser
Industrialiser : Automatiser, stabiliser et rendre reproductible les déploiements.

Sécuriser
Sécuriser : DevSecOps : Faciliter la sécurisation des applications.

Monitorer
Monitorer : surveiller et analyser afin d'assurer la continuité de service et garantir une haute disponibilité.
Infogérance
Infogérance spécialisée
Nos services managés pour votre infrastructure Cloud et votre approche DevOps : Gitlab, Github, Kubernetes, Rancher, Prometheus, Traefik, HAProxy, PostgreSQL, Redis, Django, DRF, FastApi, Flask, Python…
Infogérance sur l'environnement de votre choix : sur les principaux cloud du marché OVHcloud, Scaleway, AWS, GCP, GKE …
Infogérance DevOps
Nous adaptons votre workflow CI/CD à votre métier et à votre organisation, en intégrant des fonctionnalités avancés et appréciées de nos clients, comme par exemple le versionning automatique.
Nous hébergeons et opérons ensuite votre plateforme CI/CD sur notre cloud privé Emencia en vous garantissant sa disponibilité, sa maintenance et les évolutions de sécurité et en fonctionnalités.

Maîtrise de vos coûts d'infrastructure
Avec l’hébergement et l’infogérance de votre plateforme sur notre cloud privé, nous garantissons des coûts mensuels fixes et optimisés. La fin des mauvaises surprises sur votre facture cloud !

Souveraineté, portabilité et réversibilité
Sur notre cloud privé ou celui de votre choix (OVHcloud, Scaleway) : vos applications et données sont sécurisées et hébergées en France et en Europe, sur des solutions ouvertes et portables.

Haute Disponibilité
Notre équipe propose un service d'hébergement dédié aux stack Python (Django / Flask / ...). Nos experts proposent un service de haute disponibilité pour vos architecture critiques et complexes.

Une hotline disponible
Nos experts se tiennent à votre disposition par email, par notre système de messagerie (sur un channel qui vous est dédié) ou via notre système de ticketing pour répondre à vos questions, ou vous accompagner dans votre projet.

Une stack orienté Python opéré par des spécialistes
Nous ne sommes pas une hébergeur grand public, et avons fait le choix de proposer une expertise Python de haut niveau. C'est pourquoi nous restons concentré sur cette stack afin de vous apporter le meilleur service.

Agnostique et Open Source
Nous privilégions les technologies agnostiques et encourageons dès que cela est possible l'utilisation de technologie open source (stable et maintenable) pour garantir à nos clients la reversibilité (pas de menottes numériques, pas de lock-in)
A propos du centre de données :
EMENCIA opère ses propres baies dans plusieurs datacenters reliés par une boucle de fibre noire exploitée en 10 Gigabits/seconde. Les machines virtuelles fournies par EMENCIA dans le cadre de ce projet se situent plus précisément à Interxion (Digital Realty) Paris PAR6 et PAR 2, qui est la référence européenne en gestion de data centers depuis 1998.
Ce datacenter offre toutes les prestations classiques des centres d'hébergement haut de gamme :
- Passerelles vers des marchés émergents, ce data center constitue également des stations d’atterrissage des principaux câbles sous-marins du continent. Interxion est la plate-forme vous permettant d’étendre votre couverture dans à nouveaux marchés nationaux, régionaux et internationaux.
- Point d’implantations stratégiques : Dublin, Marseille, Sotckholm, Vienna … http://www.interxion.com/fr/Nosimplantations/
- Surveillance 24h/24 et 7j/7 par une équipe de sécurité, qui contrôle les accès physiques aux baies ;
- Vidéosurveillance des salles d'hébergement par l'équipe de sécurité ;
- Une alimentation électrique redondée grâce à deux alimentations de 15 MW par des onduleurs et des générateurs de secours ;
- Système de détection d'incendie par analyse de particules, couplé à un système d' extinction par gaz (type FM200 ou équivalent) ;
- Systèmes de refroidissement redondants avec retour de courant, maintenant une température de 18 à 25 °C et un tauxd’hygrométrie de 40 à 60%.
Un Cloud localisé en France
Nos espaces d’hébergement sont localisés dans des datacenters de référence en Ile de France et respectent les plus hauts standards du marché.

Interxion PAR2
- Utility Power Capacity: 6MW grid connection
- Total Building Size: 5,500 m²
- UPS Redundancy: 2N
- Cooling Plant Redundancy: N+1
- Adresse : 20 Bis Rue des Gardinoux Aubervilliers 93300, France

Interxion PAR6
- Utility Power Capacity: 4MVA / 20 Kv redundant grid supply
- Total Building Size: 2,400 m²
- UPS Redundancy: 2N
- Cooling Plant Redundancy: N+1
- Adresse : 11-15 rue Galilée, 94200 Ivry-sur-Seine, France


Publications
Refonte du site internet de T&T Consulting
La société T&T Consulting, Groupe NORDWAND, est une société de conseil en Télécommunications, Réseaux et Systèmes d’Information qui depuis plus de 26 ans réalise des projets à forte valeurs ajoutée sur les secteurs des Télécoms / Transports / Défense-Energie.
Refonte du site internet du groupe Squad, acteur majeur de la cybersécurité
Depuis sa création, le Groupe Squad s’est imposé comme un leader en cybersécurité. Avec 1000 collaborateurs et près de 130 Millions d'Euros de chiffre d'affaires, le Groupe Squad fait partie des premières forces cyber de France.
MLOps - quand le DevOps rencontre le machine Learning
Le MLOps, également connu sous le nom de DevOps appliqué au Machine Learning, est une approche pluridisciplinaire conçue pour intégrer le développement de modèles de machine learning (ML) et leur mise en œuvre pratique.
Cette pratique s'inspire des principes du DevOps, comme l'intégration et la livraison continue, ainsi que l'automatisation des processus informatiques, et les adapte spécifiquement au domaine du machine learning.

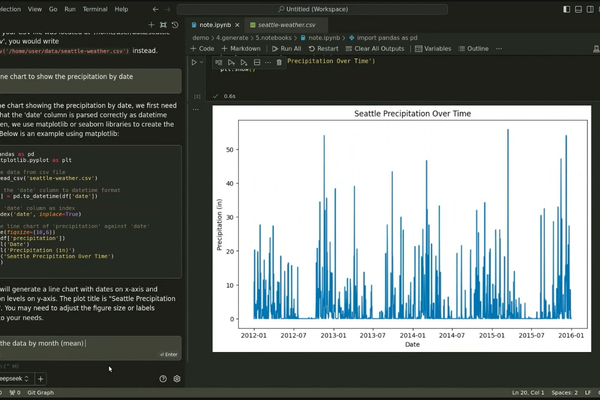
Sortie de PostgreSQL 16
Le PostgreSQL Global Development Group a annoncé le 14 septembre 2023 la sortie de PostgreSQL 16, la dernière version de la base de données open source la plus avancée au monde. Cette nouvelle version devrait s'accompagner des améliorations et nouveautés suivantes : Améliorations des performances : Les nouvelles versions de PostgreSQL s'efforcent…
Nous contacter
- contact@emencia.com
- +33 1 47 20 23 01
- 117 rue de Charenton, 75012 Paris France